Correlation length analysis (Cartwright & Whitworth 2004; Cartwright et al. 2011) investigates the spatial distribution of a point pattern at different scales, and is an alternative to Ripley’s K. Two columns of x/y coordinates in a rectangular domain are expected. CLA is simply a histogram of all pairwise distances between points, i.e. a total of N(N-1)/2 distances (black curve).
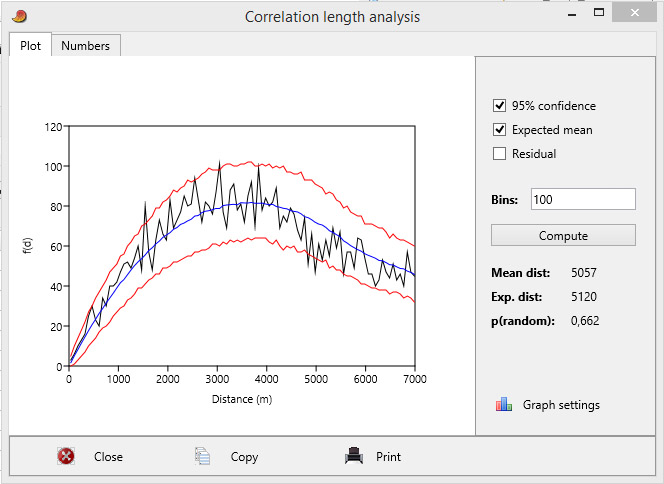
The expected curve from a random point pattern (blue curve) and its 95% confidence interval (red curves) are computed from 1000 Monte Carlo simulations of complete spatial randomness (CSR) in a rectangle of the same dimensions as the bounding rectangle of the original data. Thus, distances where the CLA curve from the data (black curve) exceeds the upper red curve, have significantly higher frequencies than expected from a random pattern.
An overall significance test is based on the observed total mean distance compared with the expected mean distance from the Monte Carlo simulations.
The number of bins can be set by the user and should be small to reduce noise, but large enough to capture details.
The “Residual” option flattens the curves on the expected mean (blue curve), i.e. the expected mean is subtracted from the curves at all distances. This can make the figure clearer especially when the confidence interval is narrow.
A comparison between Ripley’s K and correlation length analysis for a geological data set is given by Cartwright et al. (2011).
References
Cartwright, A. & Whitworth, A.P. 2004. The statistical analysis of star clusters. Monthly Notices of the Royal Astronomical Society 348:589-597
Cartwright, A., Moss, J. & Cartwright, J. 2011. New statistical methods for investigating submarine pockmarks. Computers & Geosciences 37:1595-1601.