This module plots networks (graphs), with nodes (rows in the spreadsheet) connected by edges. You can specify the network with an adjacency matrix in the spreadsheet (only the lower triangle needs to be given). In this matrix, a 1 in row i, column j implies an edge from node i to node j. All other cells should be zero. For this type of input data, you must select “User-defined similarity” as the similarity index. You can also specify similarities other than 1 for variable edge thickness (see below).
Alternatively, you can plot a network showing similarities between rows, using your raw data matrix and any similarity or distance measure you choose. You can then choose a similarity cutoff (in percent) to control the number of edges included.
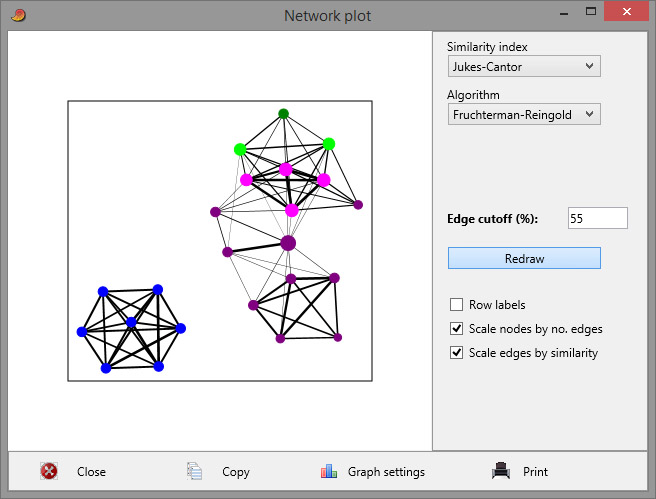
Similarity index
The similarity index to use for generating the network from the data; or choose "User-defined similarity" if an adjacency matrix is suppplied.
Algorithm
The nodes can be arranged in a circle, or they can be positioned with the Fruchterman-Reingold algorithm (1991). Using a random starting position, this algorithm will produce a new layout each time, so click “Redraw” a few times until you get a pleasing result.
The “Bipartite linear” option plots a bipartite graph with the data rows shown as graph nodes in one vertical column and the data columns as nodes in another column. A non-zero value in a data cell will produce an edge from the corresponding row node to the column node. This format is typically used for ecological data matrices with samples in rows and taxa in columns.
“Bipartite Fruchterman-Reingold” produces a similar bipartite graph but using the F-R algorithm.
Edge cutoff (%)
Zero percent cutoff will give a fully connected (complete) network with edges between all pairs of nodes; fifty percent will show only edges between nodes that are more than 50% similar.
Row labels
Include the row names on the plot.
Scale nodes by no. edges
Set the diameter of nodes proportional to the number of edges connected to it.
Scale edges by similarity
Set the thickness of edges proportional to the similarity.
Reference
Fruchterman, T. M. J. & Reingold, E. M. 1991. Graph drawing by force-directed placement. Software: Practice and Experience 21:1129–1164.