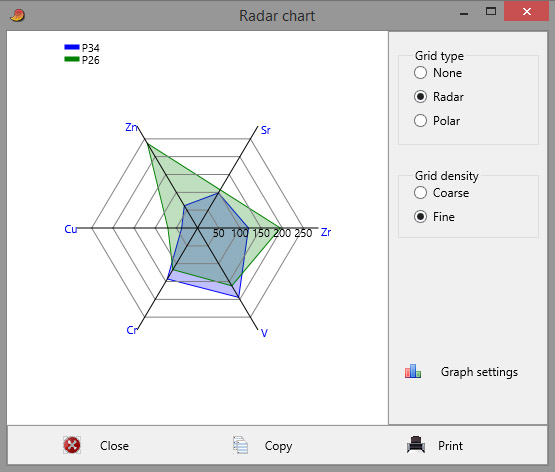
For visualizing multivariate data. One radar chart (polygon) will be plotted for each row in the data. In the example below, the data consisted of two rows (P34 and P26) and six columns (variables). The grid lines can be polygons (radar chart) or circles (polar chart).
The module will also accept a single column of data.
Another use of this module is for visualizing circular or cyclic data such as animal activity through 24 hours or sunlight through 12 months.
Missing values are treated as zero.