Ripley's K (Ripley 1979) is the average point count as a function of distance d from every point. It is useful when point pattern characteristics change with scale, e.g. overdispersion over small distances but clustering over large distances. Two columns of x/y coordinates in a rectangular domain are expected.
For complete spatial randomness (CSR), K(d) is expected to increase as the square of d. The L(d) function is a corresponding linearizing transformation of K(d). For CSR, L(d)=d, and L(d)-d=0. A 95% confidence interval for CSR is estimated using 1000 Monte Carlo simulations within the bounding rectangle (previous versions used an approximation). Ripley's edge correction is included, giving weights to counts depending on the proportion of the test circle that is inside the rectangular domain.
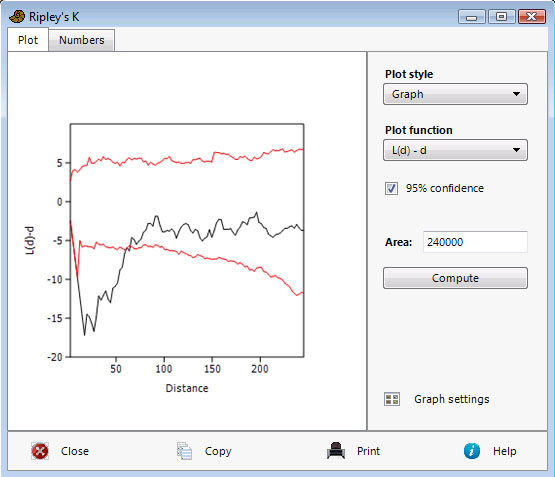
The example above shows locations of volcanic pipes. L(d)-d is below the 95% confidence interval of CSR, indicating lateral inhibition, up to a distance of ca. 70 m. For larger distances, the curve flattens in the manner expected from CSR.
Area
For the correct calculation of Ripley's K, the area must be known. In the first run, the area is computed using the smallest bounding rectangle, but this can both over- and underestimate the real area. The area can therefore be adjusted by the user. An overestimated area will typically show up as a strong overall linear trend with positive slope for L(d)-d.
Fractal dimension
The fractal dimension (if any) can be estimated as the asymptotic linear slope in a log-log plot of K(d). For CSR, the log-log slope should be 2.0. Fractals should have slopes less than 2.
Reference
Ripley, B.D. 1979. Tests of 'randomness' for spatial point patterns. Journal of the Royal Statistical Society, ser. B 41:368-374.