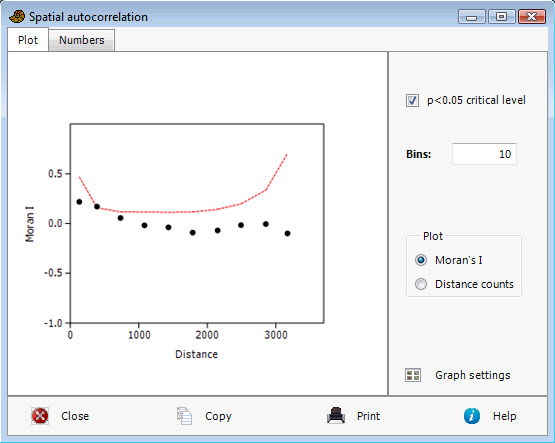
Spatial autocorrelation in Past requires three columns, containing x and y coordinates and corresponding data values z for a number of points. The Moran’s I correlation statistic is then computed within each of a number of distance classes (bins), ranging from small to large distances.
The one-tailed critical value for p<0.05 can be plotted for each bin. Moran’s I values exceeding the critical value may be considered significant, but Bonferroni or other adjustment for multiple testing should be considered because of the several bins.
The calculation follows Legendre & Legendre (1998). For computational details, see the Past manual.
Reference
Legendre, P. & Legendre, L. 1998. Numerical Ecology, 2nd English ed. Elsevier, 853 pp.