Plotting of Venn diagrams for two or three sets, with a number of options. Circles can be plotted with equal sizes, or with sizes and overlaps proportional to the number of members.
Two sets
The input data for two sets A and B can be given as a 2x2 contingency table on this form:
|
A and B |
A, not B |
|
B, not A |
Not A, not B |
The not A, not B value is only used when the Show none box is ticked.
Alternatively, the values can be given in a single column with 3 or 4 rows as follows:
A, not B
B, not A
A and B
Not A, not B (this value is optional)
Finally, you can supply a binary (0/1) matrix with any number of items in rows, and two columns A and B corresponding to the two sets. Each item (row) can be a member of set A (value 1 in column A) or set B (value 1 in column B), or neither (0 in both columns) or both (1 in both columns).
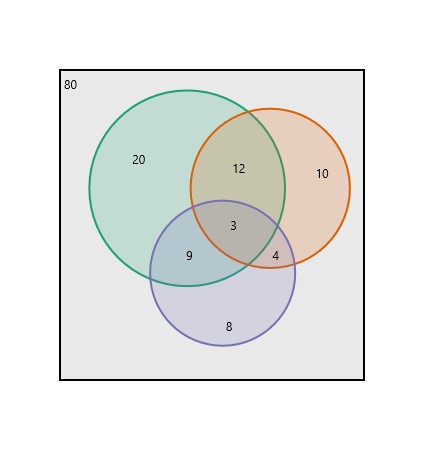
Three sets
The input data for three sets A, B and C are given in a single column with 7 or 8 rows:
A, not B, not C (ABC=100)
B, not A, not C (ABC=010)
A and B, not C (ABC=110)
C, not A, not B (ABC=001)
A and C, not B (ABC=101)
B and C, not A (ABC=011)
A and B and C (ABC=111)
not A, not B, not C (ABC=000) (this value is optional)
Example data:
20
10
12
8
9
4
3
80
Alternatively, you can supply a binary matrix with 3 columns and any number of rows, similarly as described above for two sets.
Plotting of a fully size-proportional 3-set Venn diagram with circles is not generally possible. Past prioritizes the total sizes of circles and the pairwise overlapping regions. The algorithm is inspired by the matplotlib-venn Python code by Konstantin Tretyakov.
Four sets
Only the binary input format is available, with four columns corresponding to the four sets, and items in rows. A full, four-set Venn diagram cannot be constructed with circles, so ellipses are used. Proportional sizes are not attempted.